Programming with Coat
Start your Eclipse and make sure
git in the form of EGit
is installed, then clone https://
(no passwd required). Then go looking at the coat.DemoFactory
class.
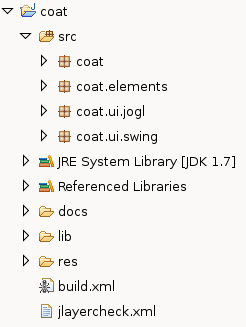
Just kidding. (Except for the "checkout" part). In my Eclipse workspace, the project structure looks like this:

There is the src directory, then docs (UML,
launchers, a bit of text), lib for JOGL jars and libraries, res
for resources such as images, a build.xml for Ant and a jlayercheck.xml
for package dependency control.
Creating Graphs and a Pane
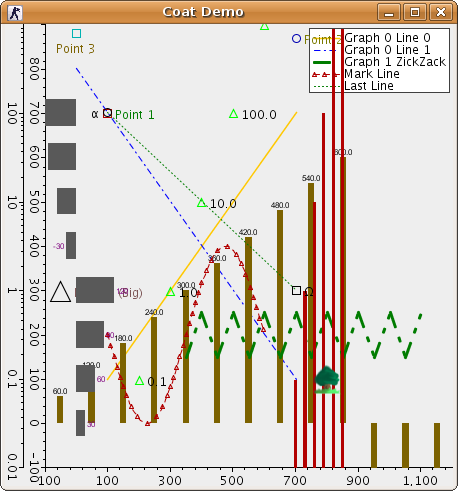
Consider the screenshot to the right. To reproduce this, we take the following steps:
- Creating a pane.
- Creating the graphs that reside in it.
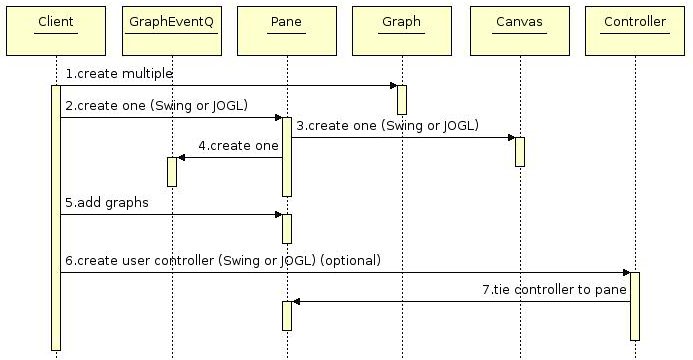
Have a look at the internal processes with the following UML sequence diagram.

You are the client, and create some graphs. Then, you create e.g. a SwingPane.
This triggers the creation of a SwingCanvas and a GraphEventQueue
(in case of Swing, this queue is asynchronous; in case of JOGL, an FPSAnimator
triggers the queue).
Then, you register the graphs with the pane. In the demos, a user
controller is added to the pane (using standard MouseListener
and KeyboardListener). This is outside the scope of the Coat
functionality and you are expected to do it by yourself in your
application.
Adding Elements
After you have the graphs set up, start adding the elements (such as
line legends, axis, points, bars and lines). The method for it is
always the same: Graph.addData(). Let's go into more detail
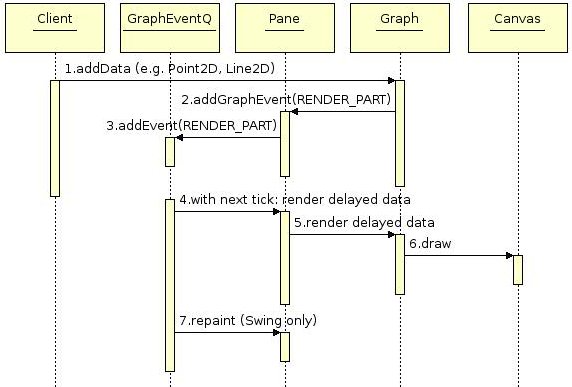
with the next sequence diagram.

Whenever you add new data to a graph, the graph event queue is
notified (normally with RENDER_PART, but screen-changing
additions such as an axis may trigger RENDER_FULL). Whenever
you modify something radically (e.g. by calling Graph.scale()
or by simple setting a new text on a point), you are expected to call
addGraphEvent(
on the pane.
The graph event queue only acts if there is a request for action. If
so, it calls the graphs with either a full render() or in the
case of additions with renderDelayedData(), which is much
faster. Note that taking away something must result in a full render,
as I cannot just overwrite the area: What if something else overlapped
with the removed element?
Adding elements is thread safe; the HeartBeatProducer
and SpiralProducer inner classes of the
DemoFactory are trying to prove it.
Note: If you added new data to a line, call Graph
afterwards, because the line was already added normally to the graph.
Finetuning the Graphs
The default layout of the graphs is "stacked". To get to the overlay
distribution of the screen shot to the right, use
setLayerModus(
on the pane.
And if you want to scale the user space, call e.g.
setXScaleModus(
on the graph. Note that you must still call Graph.scale()
after each scale-worthy addition of elements; doing it automatically
was just too performance consuming.
I have left out a discussion of the actual elements
(Point2D, Bar2D, Line2D,
Axis and LineLegend)
because their getters and setters seemed pretty self-explanatory to me.
Have a look at the javadoc for
details.
Any question left? Contact me (see menu bar) and I will see what I can do.